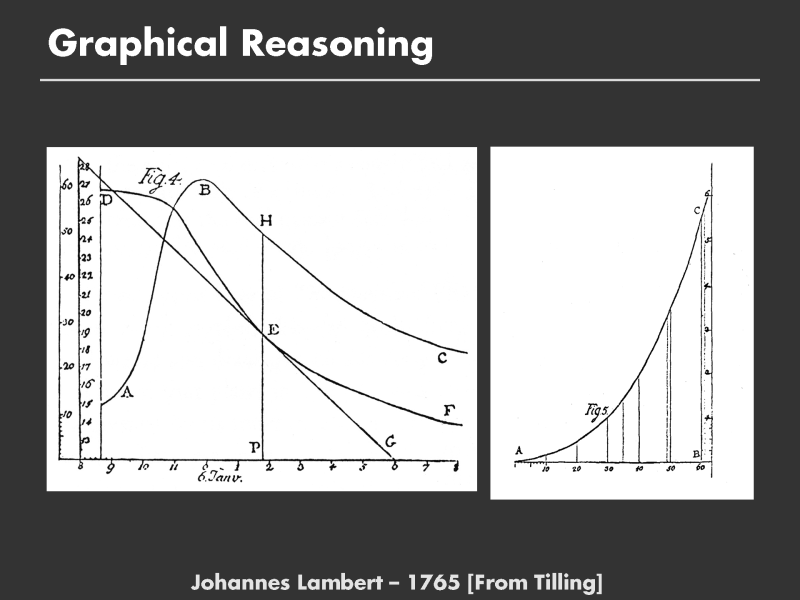
From this graph, he constructed the following graph: the evaporation rate as a function of temperature. The slope of the curve at E, DEG, is the change in height of water per unit time, or the evaporation rate, the desired quantity. He derived the slope at each time and plotted the slope vs. the temperature at that time.
Lambert was the first to manipulate experimental data in this way. Computing the tangent of the curve to estimate the derivative is an example of a graphical calculation. However, what was most novel was that he then replotted his data to make a graph of evaporation rate vs. temperature.
Although we take it for granted, this is quite a sophisticated form of reasoning and was completely novel at the time.