Here is what I think is one of the most important scientific visualizations of all time. It was made by Lambert, someone whose work we all know well since he formulated Lambert?s Cosine Law for calculating the irradiance on a surface. Lambert founded the geometric study of photometry and radiometry ? the science of light measurement. I have studied his great book Photometria (1769) and have translated several of his discoveries into computer graphics algorithms; it was an easy way to write a lot of SIGGRAPH papers.
But the reason he is most famous is that he was one the first scientists to use graphs to analyze experimental data.
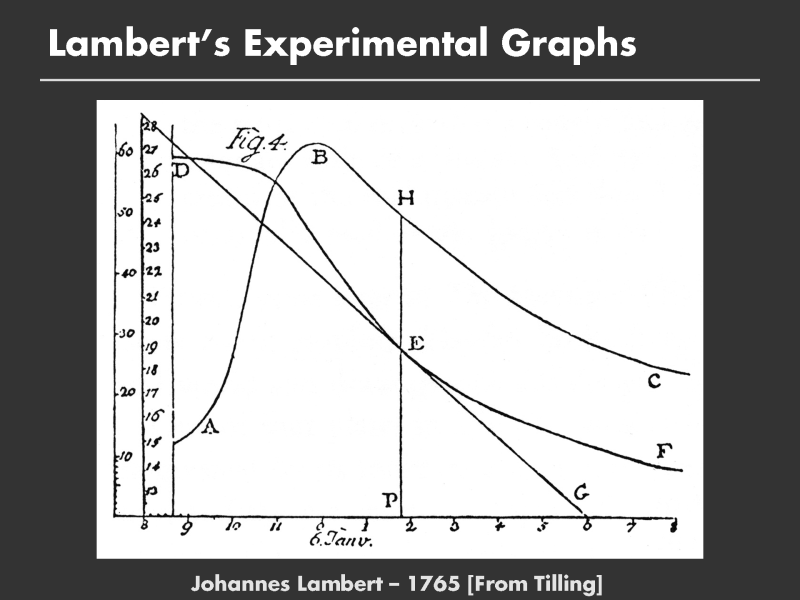
This picture shows his graphical derivation of the evaporation rate of water as a function of temperature.
Lambert conducted an experiment where he measured the height of water in a capillary tube as a function of time as he heated the tube with a flame. Such graphs naturally evolved from instruments that measured the real world.
Curve DEF shows the decreasing height of water in the capillary tube over time.
Curve ABC shows the temperature measured simultaneously.