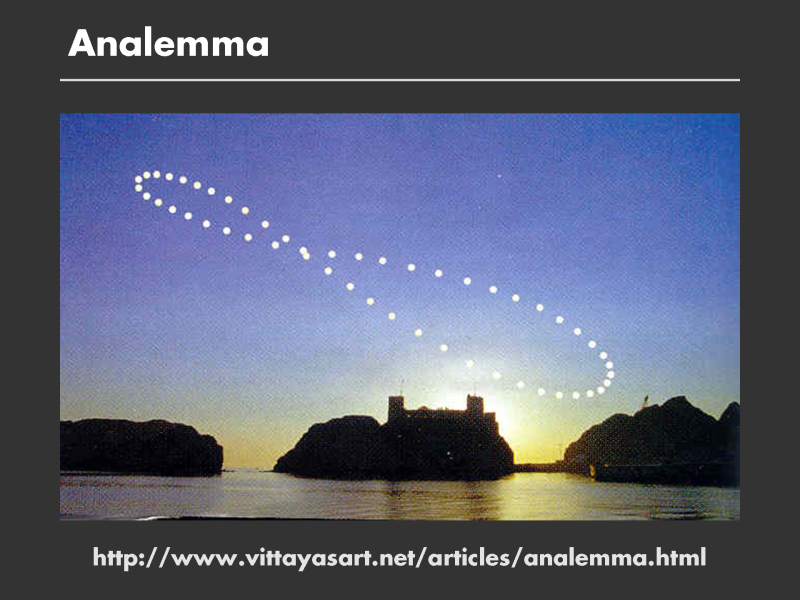
A neat example of a self-graphing phenomenon is an analemma. This picture is produced using a multiple exposure of the sun at the same time throughout the year. When you do that, you see an intriguing figure 8 curve. Note that the figure 8 is tilted and not symmetric. This mystery of this path of the sun baffled early astronomers.
Whenever I see this figure it makes me think of the tedious and heroic calculations performed by ancient astronomers. And the brilliant theoretical leap made by Newton in deriving the fact that the orbits of the planets are elliptical from the inverse square law. It took a long time to figure out that the shape can be explained by considering (1) the earth?s elliptical orbit around the sun and (2) the latitude of the observer.
One day I was talking to Don Norman and he was telling me that sundials were not very accurate clocks. The next time I looked at this picture, I thought, ?Now I understand why it is so hard to make an accurate sundial.? The position of the shadow at 12noon will change throughout the year. That is an example of an insight triggered by a picture!