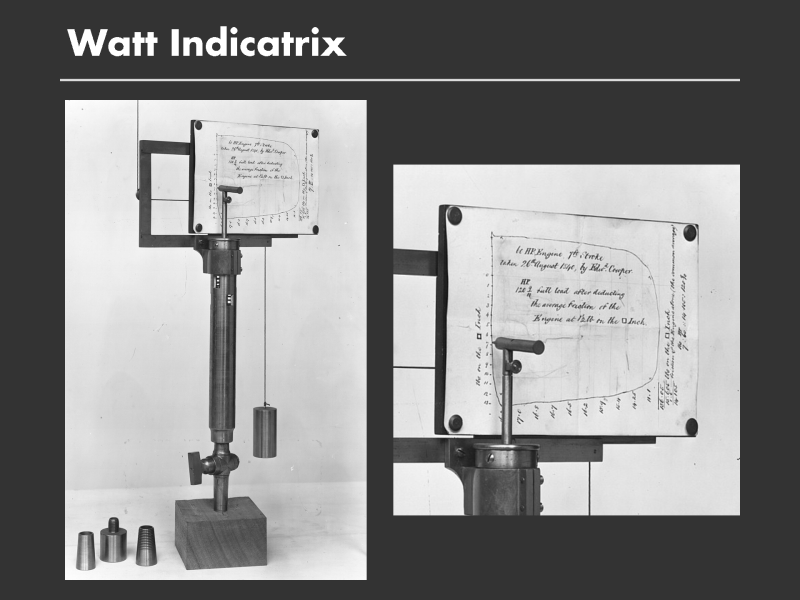
Here is one of the earliest examples of a graphing instrument, James Watt?s indicatrix. James Watt is best-known as the inventor of the steam engine, which led to the industrial revolution.
Here is a instrument he invented to measure the performance of the engine. This instrument was so valuable that he kept it secret for many years. On the left you see a vertical tube that looks like a bicycle pump. The tube contains a piston. As the pressure increases, the piston rises, as the pressure decreases, the piston falls. The pump is also attached to the drive shaft of the engine. As the drive shaft moves back and forth, the tube moves left and right. The drive shaft?s position is proportional to the volume of gas in the chamber.
Attached to this mechanism is a pen over a piece of graph paper. The pen traces a curve as the steam engine goes through its thermodynamic cycle. The x-axis of the graph represents volume and the y-axis pressure. Recall that the product of pressure and volume is work, and so the area inside the curve measures the work performed by the engine. This instrument allowed Watt to evaluate different engine designs, and to tune the engine to maximize it?s performance.
Reference:
[1] p. 129, Chapter 6, Science since Babel: Graphs, Automatic Recording Devices and the Universal Language of Instrument, In Instruments and the Imagination, T. L. Hankins and R. J. Silverman, Princeton University Press, 1995.
[2] Blood, Dirt and Nomograms, T. Hankins, Isis, 1999, 90: 50 80.