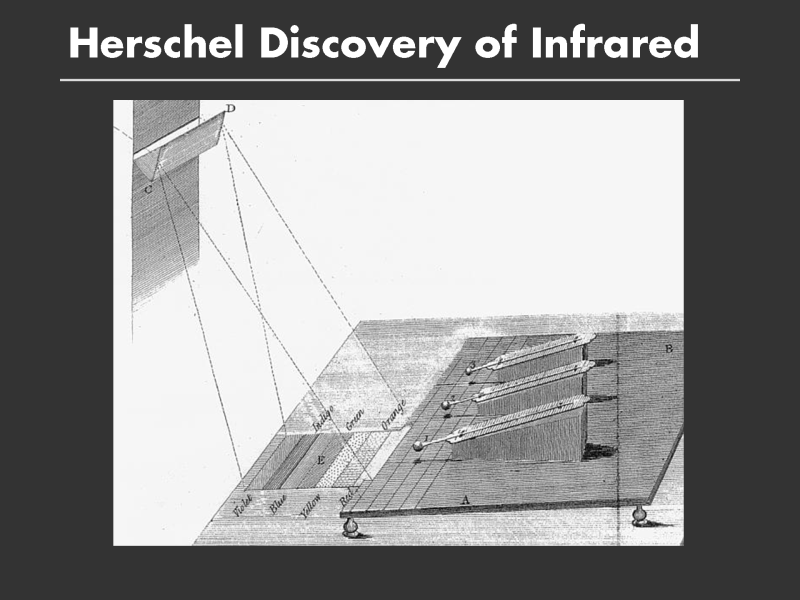
Graphs evolved from self-illustrating phenomena. Shown here is an illustration of Herschel's experimental setup that led to the discovery of infrared radiation.
Sunlight passes through a prism (CD), forming the usual rainbow spectrum (E). At the edge of the visible, beyond the red band, he placed a row of thermometers. Thermometer 1, aligned with the spectrum, registers a rise in temperature, while the control thermometers 2 and 3 do not. This shows that there is energy from the sun that isn?t visible. Since the spectrum is mapped to position, it is possible to estimate the amount of energy as a function of wavelength. By extrapolating the wavelength scale, it is possible to estimate the wavelength of the invisible radiation.
This illustration not only shows the phenomenon, but documents the experimental setup and the clever controls (the upper thermometers are not exposed to sunlight and record the normal temperature).
NOTE: A better example here would be a time-series. Perhaps Plot?s weather measurements and Marey?s blood pressure instrument.