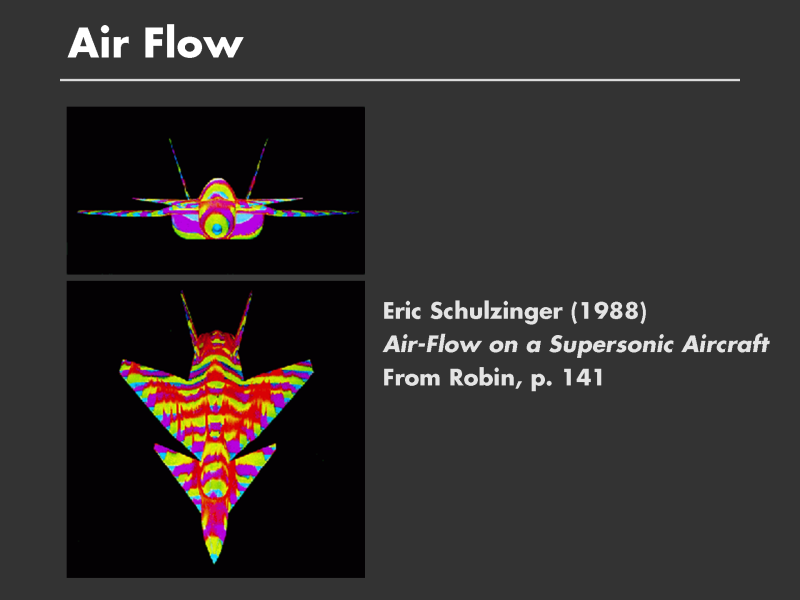
These pictures of a model airplane look computer-generated, perhaps because of the garish, saturated, color scheme. Surprisingly, these images are actually photographs.
In this experiment, a scale model of the aircraft was placed in a wind tunnel and bands of colored oil were applied to the model. Then a blast of air was applied at the speed of flight (scaled to the scale of the model).
If you look carefully, you see streaming, vertical fringes breaking up the regular, horizontal, bands of oil. These regions are associated with high turbulence. Since turbulence increases the drag on the airplane, modifying the shape of the surfaces in these regions will improve the performance of the aircraft. This visualization clearly identifies those regions.
Reference:
[1] p. 141, The Scientific Image, H. Robin
[2] A great book of flow visualizations: An Album of Fluid Motion, M. Van Dyke, Parabolic Press, 1982. The beautiful picture of the shock waves around a projectile taken by E. Mach (next slide) serves as the frontispiece.
[3] More recent book on flow visualization