The dominant paradigm for World Wide Web navigation is pointing and clicking through traditional hypertext browsers. Clicking one's way through the Web has become very popular, but can also be very disorienting. The Web is so interconnected and huge that it is difficult to establish a mental model of its structure.
Flat one-dimensional history lists are one common navigational aid. Such lists provide a way to think about many documents at once, but offer no help in understanding the connections between them. Traditional two-dimensional Web browsers provide a way to focus on an individual document and see all of its outgoing connections, but do not show incoming links or offer an overview of more than one document at once.
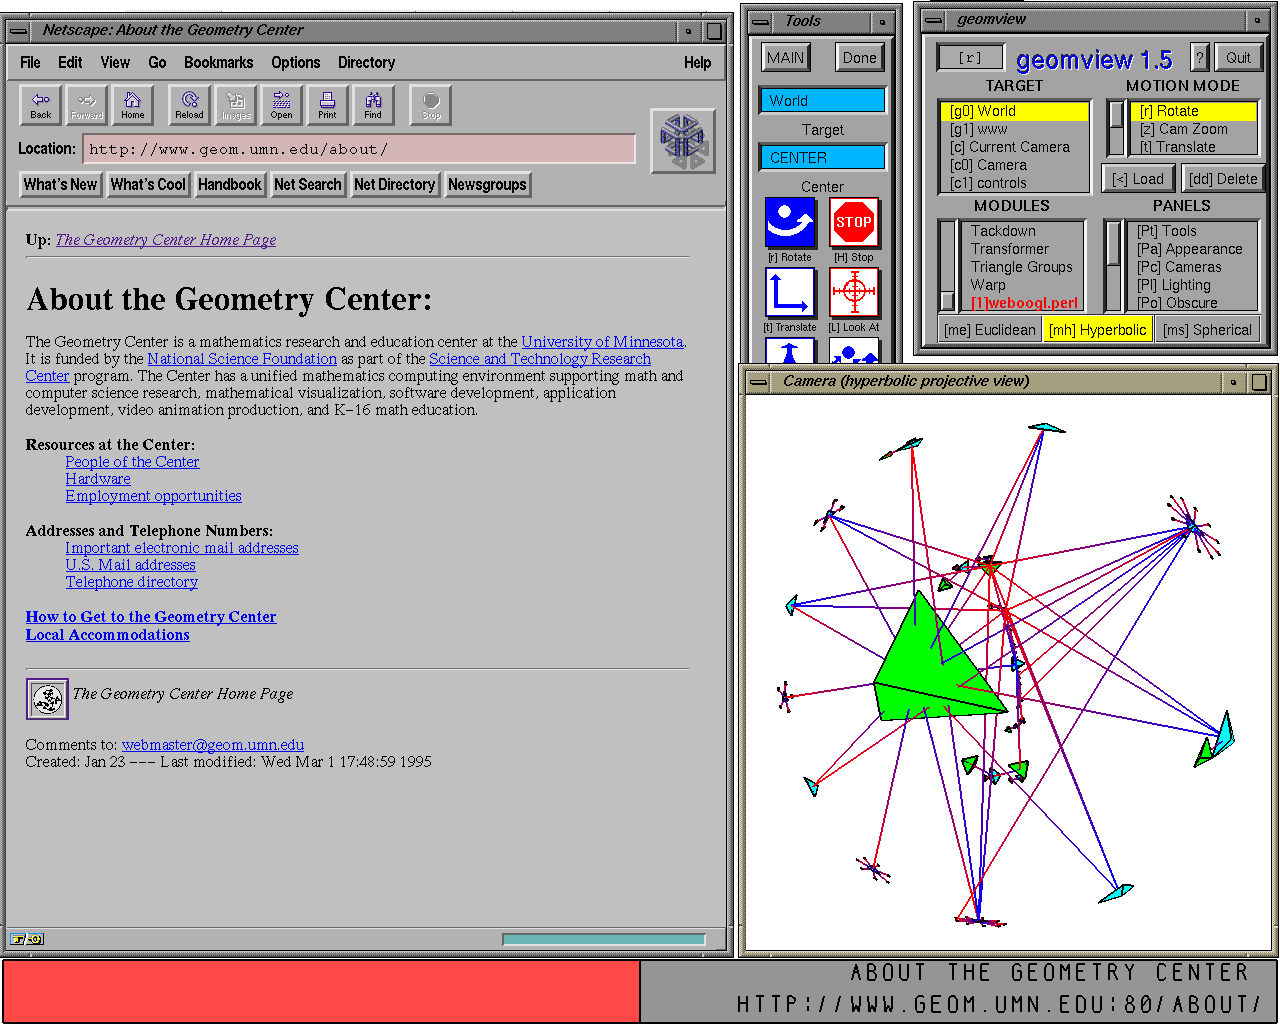
Moving up to three dimensions allows us to see both multiple documents and the links between them. The Web is far too large to see all at once, but we can explore sections of it and build 3D graphical representations which can be viewed in a 3D Web browser. Such browsers are becoming widespread with the recent release of the VRML standard. Just as traditional browsers allow one to follow links in hypertext, the VRML standard provides a way to attach three dimensional link anchors to 3D data files. The graphical representation of a document is the anchor which points to the document itself itself. Actions taken in the 3D browser can control the 2D browser and vice versa. Figure 1 shows a typical session.
Figure 1: Using the WebOOGL system for information visualization in hyperbolic space
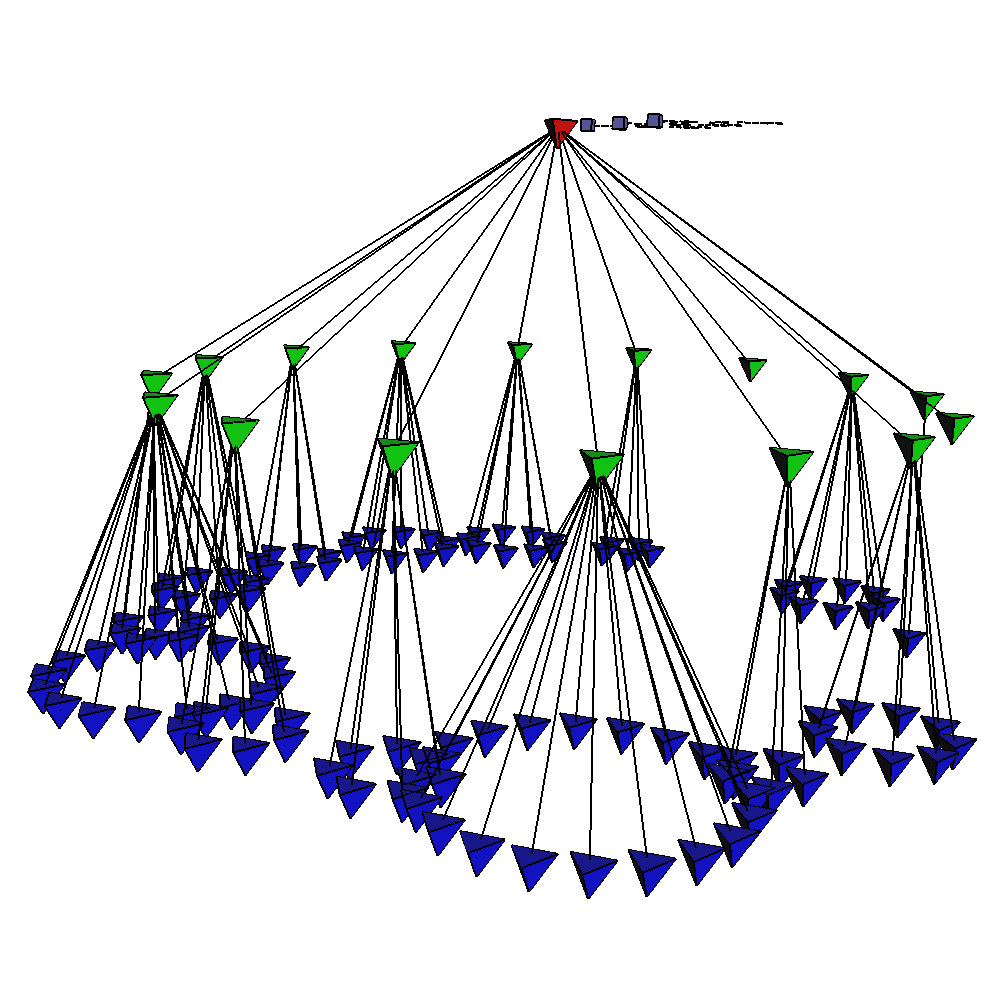
Although the Web is non-linear, we can start at any document and impose a tree structure: the chosen node is the root, each outgoing link is a first-generation child, the links in these documents are grandchildren, and so on. We construct a 3D graphical representation of a piece of this structure, drawing tetrahedra at the nodes and lines between them to represent hyperlinks. Our layout is a variant of the Xerox PARC Cone Tree [9], where the parent node is at the tip of the cone and the edges leading to the children are drawn radiating outwards to the rim.
Figure 2: Euclidean conetree, showing two levels of the 1994 Geometry Center Web
The problem, as we can see in Figure 2, is that our cone trees become cluttered very quickly. There is no good way of embedding an exponentially growing tree in Euclidean space that allows us to simultaneously see both the entire structure and a closeup of a particular region.
The solution is to use hyperbolic cone trees. Hyperbolic geometry offers us an elegant way to see the big picture and the interesting details at the same time.