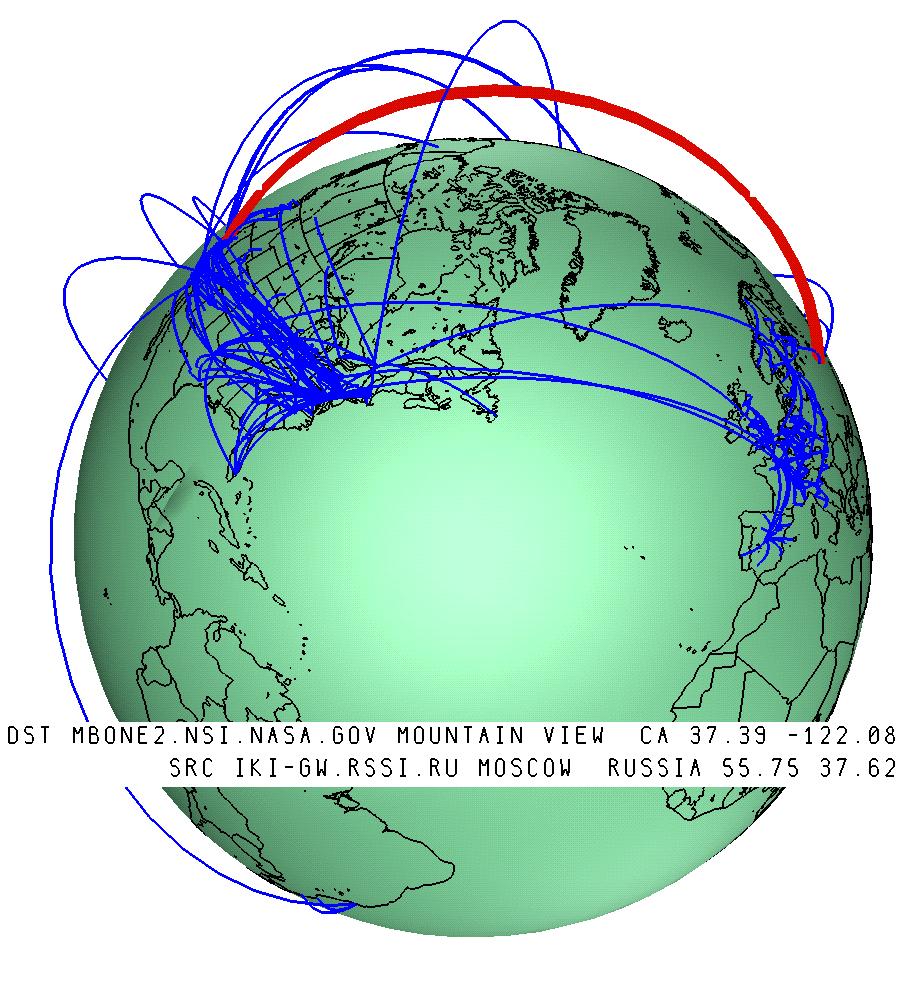
Figure 1: A 3D interactive map of the MBone tunnel structure, drawn as arcs on a globe. The endpoints of the tunnels are drawn at the determined geographic locations of the MBone router machines. In this and all figures not otherwise labeled, we draw nearly 700 of the 4400 tunnels comprising the MBone on June 15, 1996. Over 3200 are not drawn because we have determined the endpoints to be co-located, while the remainder are ignored because we were unable to find their geographic position. The text window below shows the hostname, city and state/country name, latitude, and longitude of the endpoints of the selected tunnel. A URL pointing to this information is bound to the 3D representation of each tunnel.
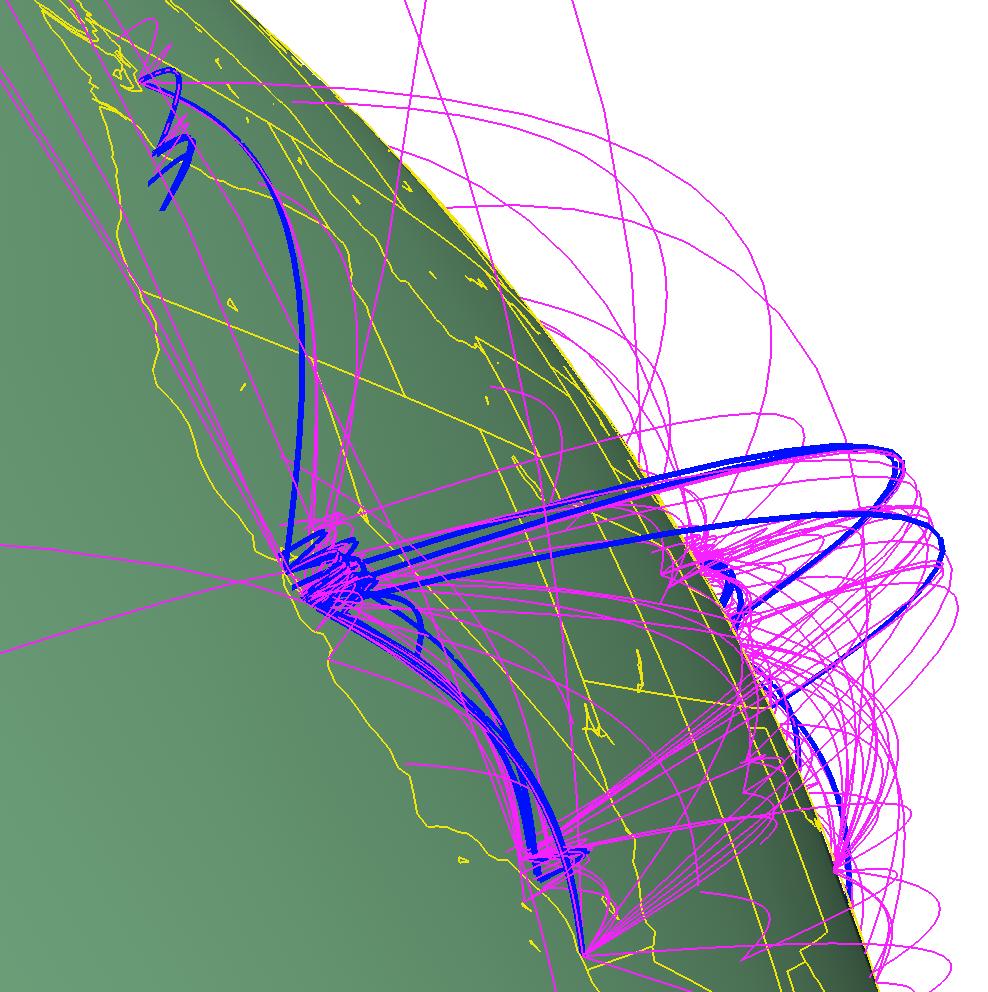
Figure 2: We highlight the few MBone tunnels participating in PIM, a more advanced (but still not operationally stable) unicast routing protocol-independent multicast routing protocol. Three visualization techniques are used in this figure: distance-based arc height, 3D navigation and grouping. The ``horizon view'' results from zooming close and clicking on a point on the earth's surface to act as the center of rotation. Moving our eyepoint close to the earth also emphasizes the different arc heights. Finally, the PIM tunnels are drawn with a different color and linewidth than the default grouping.
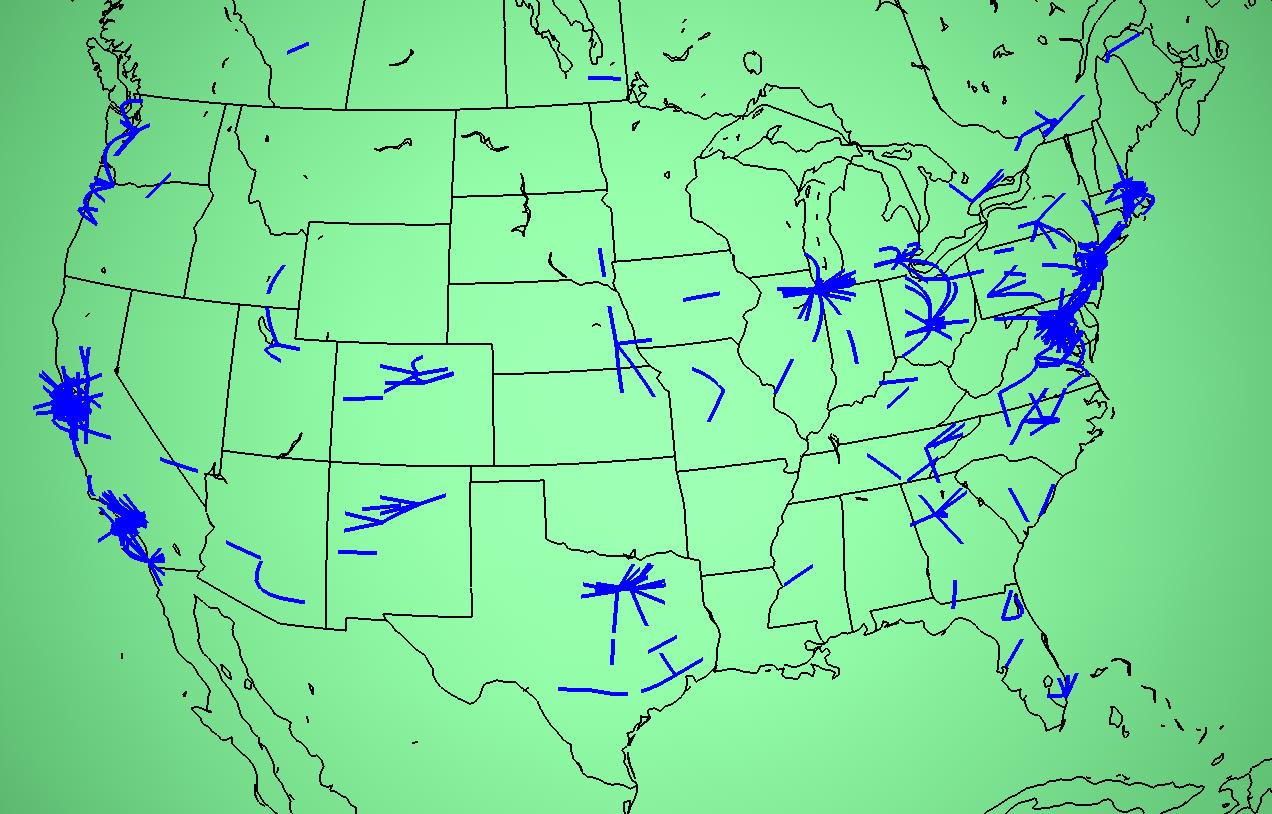
Figure 3: Only the segments within a user-defined radius around the tunnel endpoints are drawn in this thresholded view, which reveals local details hidden in Figure 4.
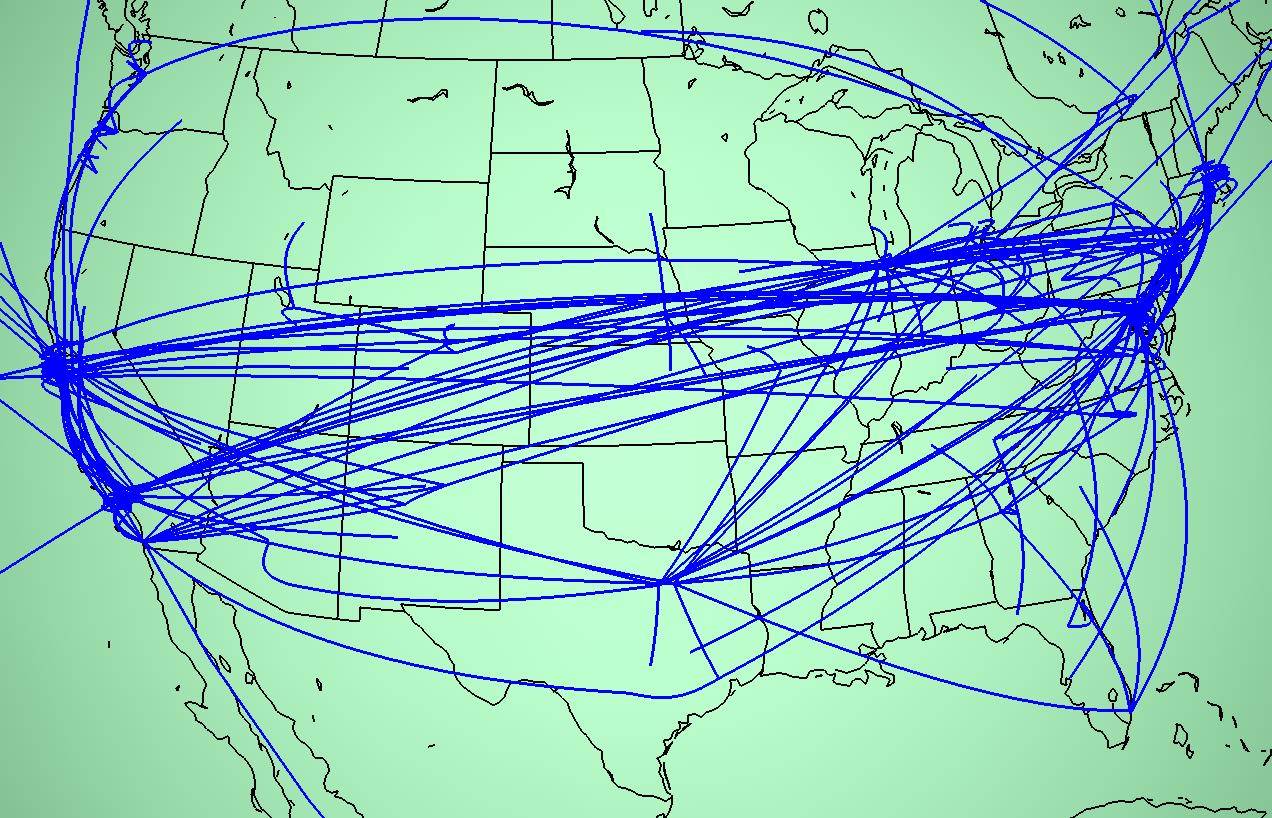
Figure 4: Two regional closeup views of the MBone. The United States tunnel structure above is quite redundant compared to the European structure below. Reducing number of coast-to-coast tunnels would reduce offered workload to the often congested underlying unicast infrastructure. All of these tunnels may be carrying identical data.
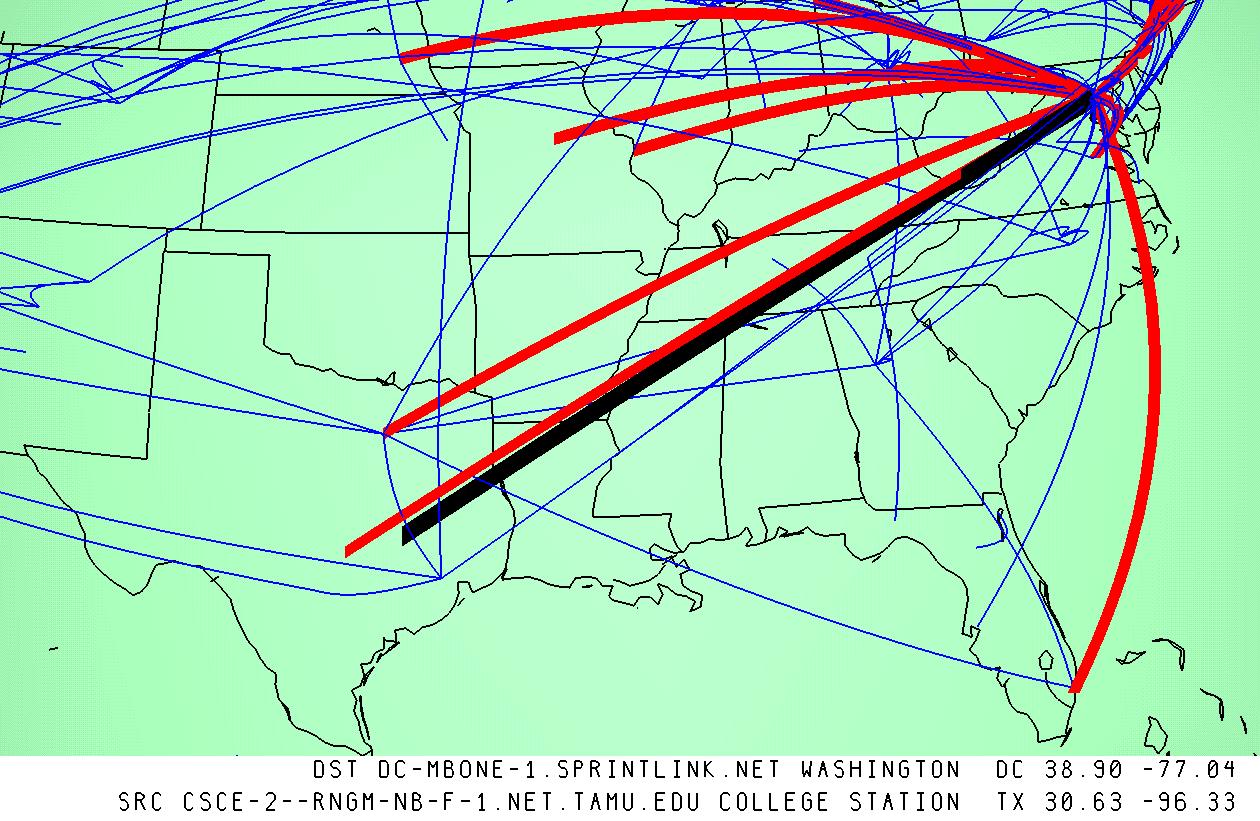
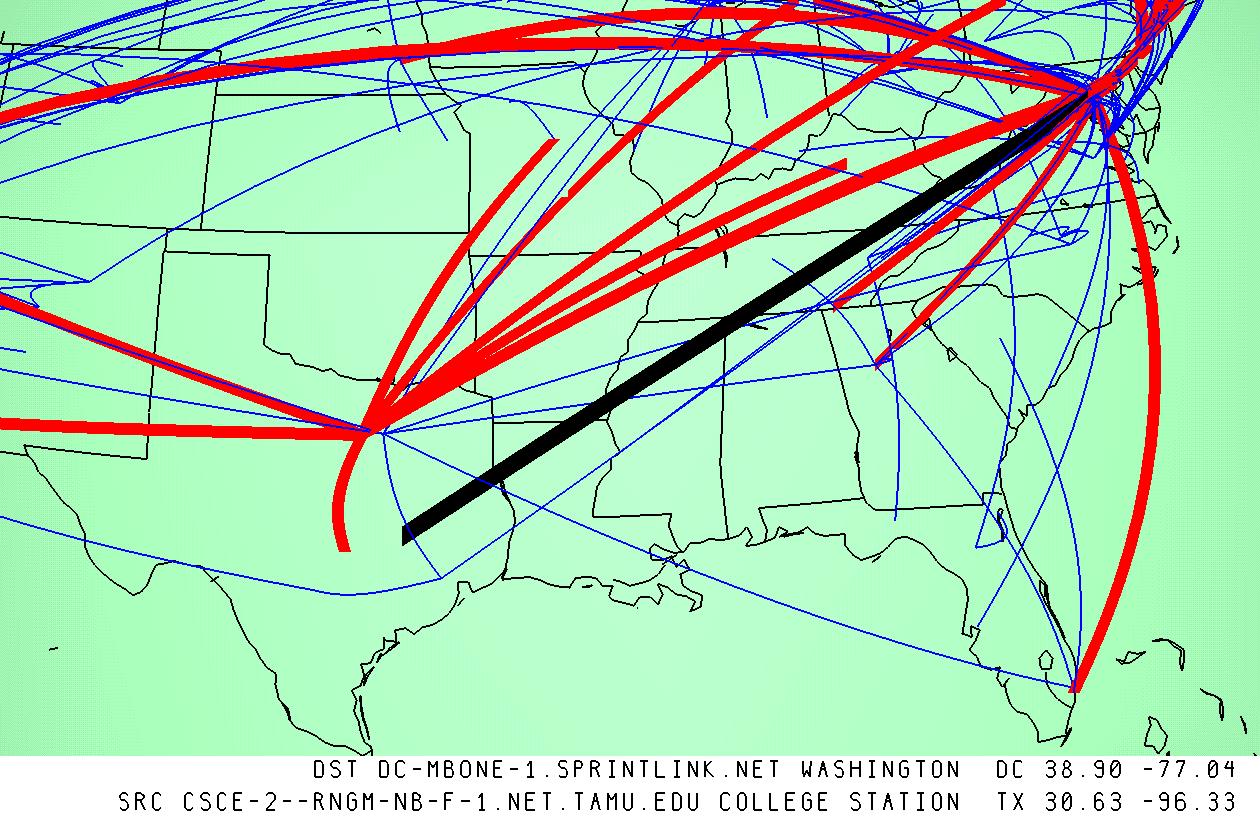
Figure 5: A view of the MBone tunnel structure in Texas at two different times: above is February 12, 1996, below is June 15, 1996. Tunnels in the Sprintlink network are drawn in thicker dark arcs in both, and the selection of a tunnel between Texas A&M University and Washington, DC is shown with a very thick black arc. We see that altough Sprint has established a major new hub very close to TAMU, that closer source is still unleveraged in June.
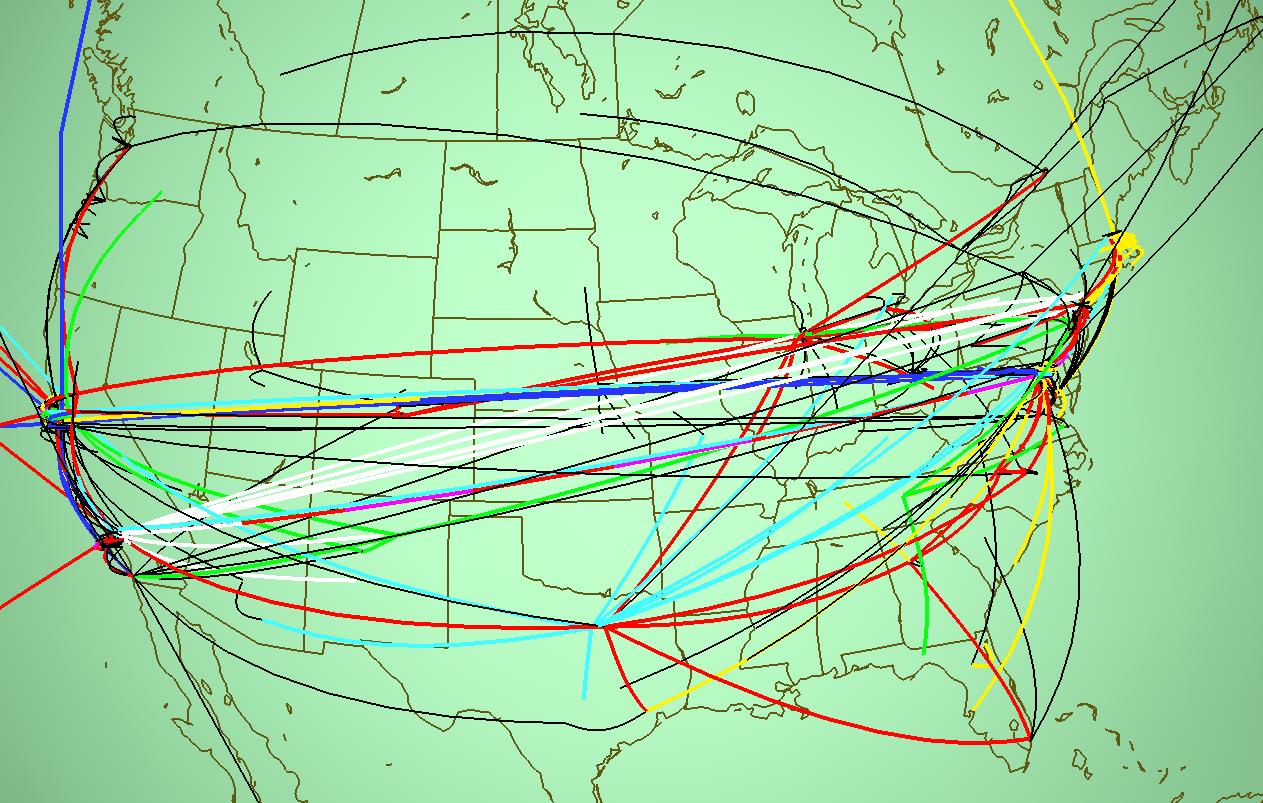
Figure 6: MBone tunnels of the major backbone networks, colored by provider: MCI in red, Sprintlink in cyan, NASA in blue, ESnet in green, Dartnet in magenta, BBNPlanet in yellow, and ANS in white. All other tunnels are drawn in thin black lines.
[VRML
both
|
one
|
none
|
combination
]
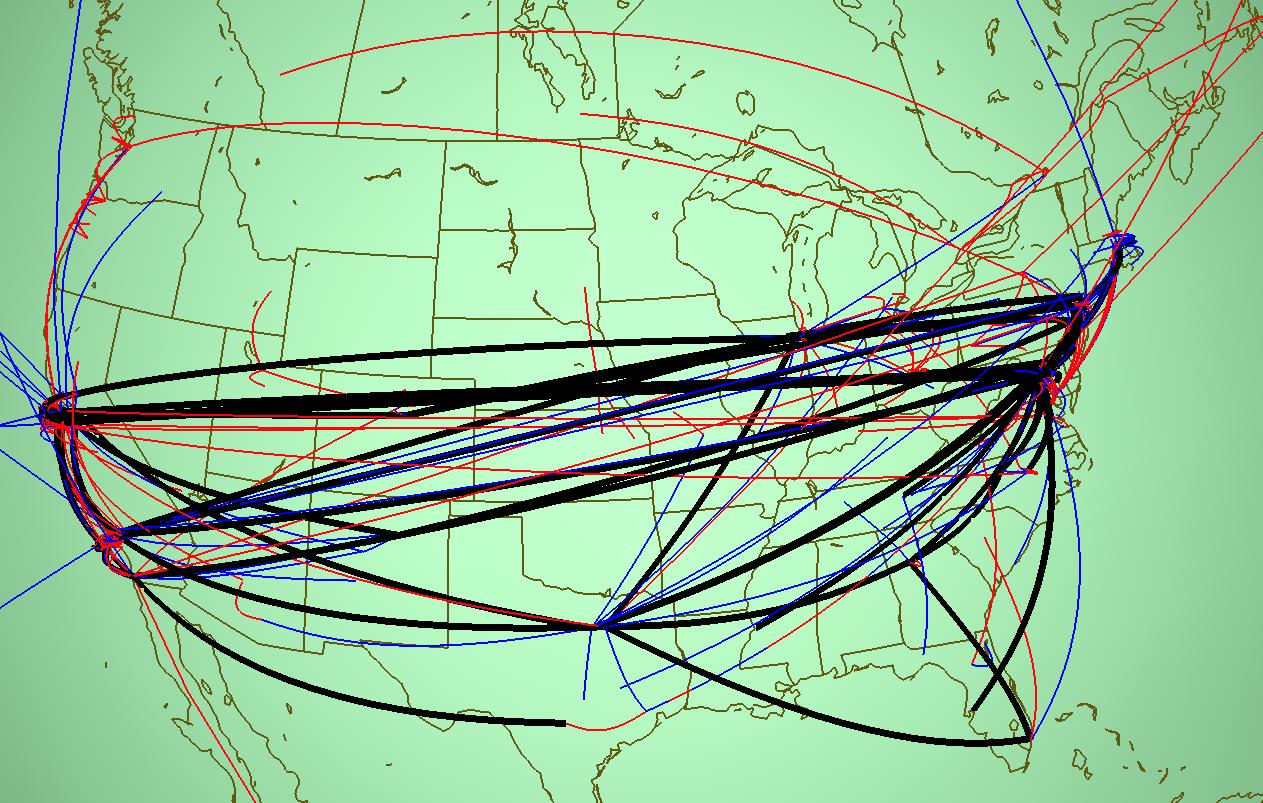
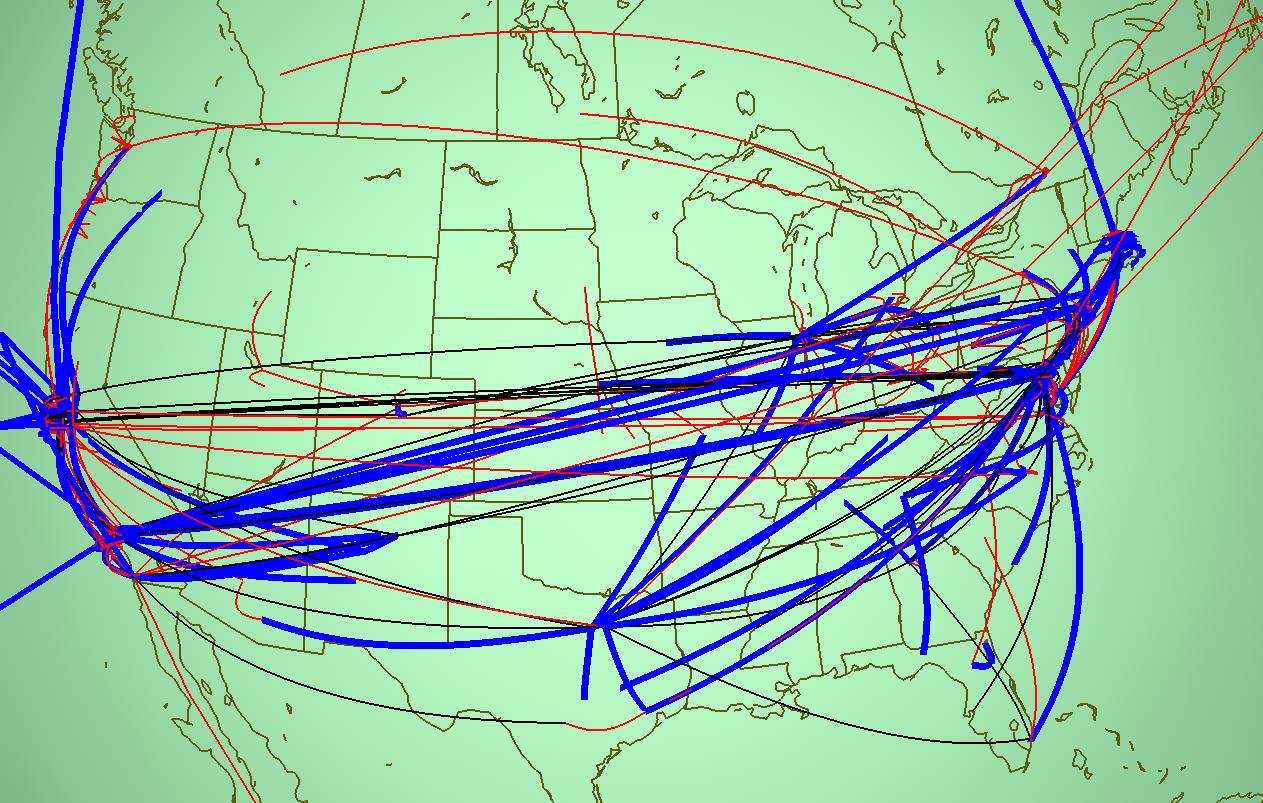
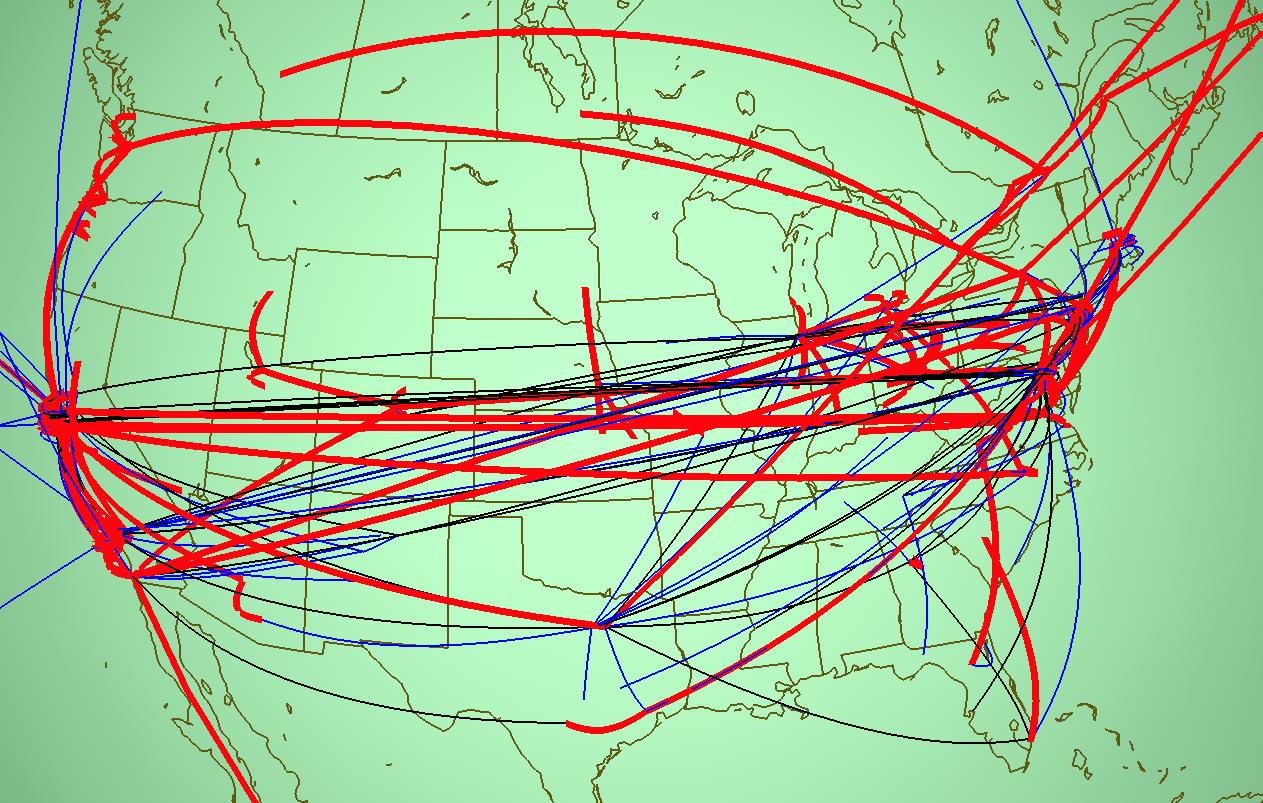
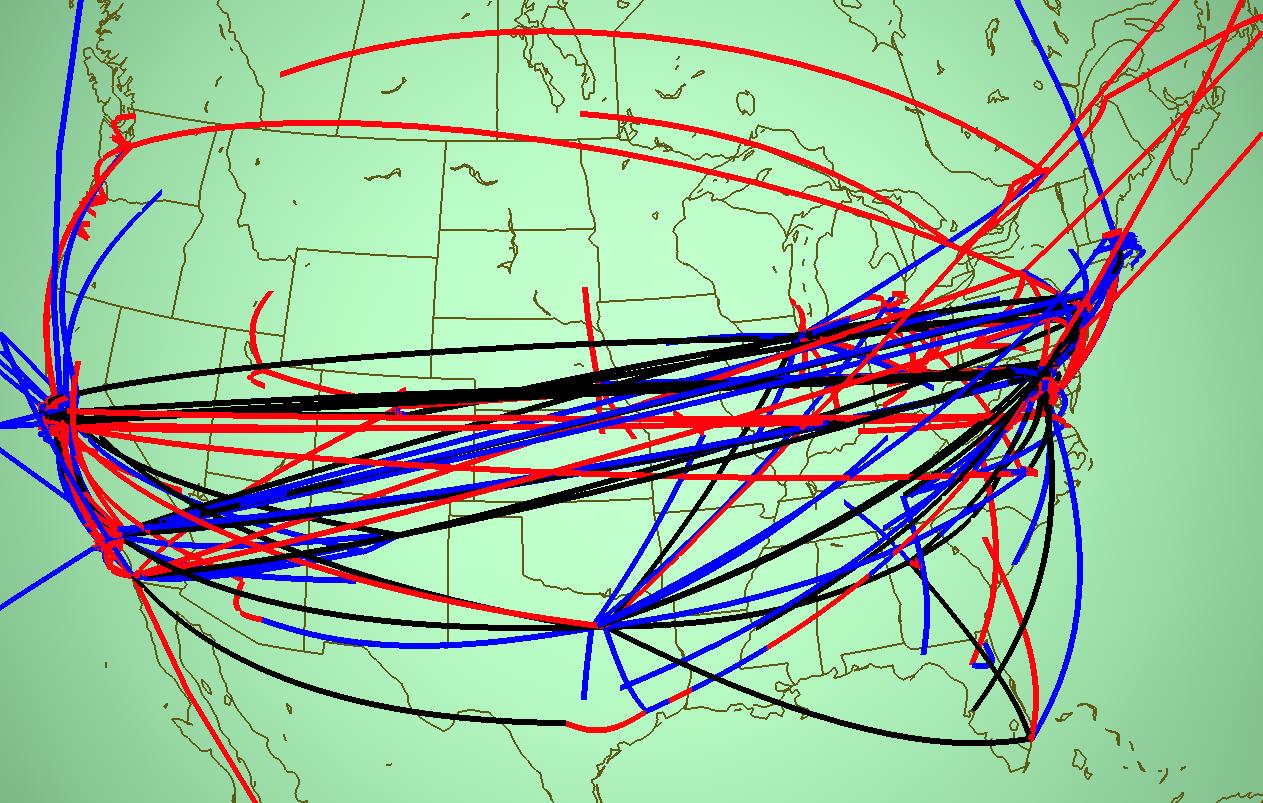
Figure 7: MBone tunnels grouped by backbone status: black tunnels have a major provider at both ends, blue tunnels have one endpoint which is a backbone, and neither endpoint of a red tunnel is attached to one of the backbones. The first three views each show a single group drawn with thick lines, while the last shows all groups equally emphasized.