This page shows some (mostly old) results from our volume rendering research project. For some really old volume renderings, look at Marc Levoy's 1988 IEEE CG&A paper, Display of Surfaces from Volume Data. To look at results from our other projects, browse through our list of current research projects. Or you can return to our home page.
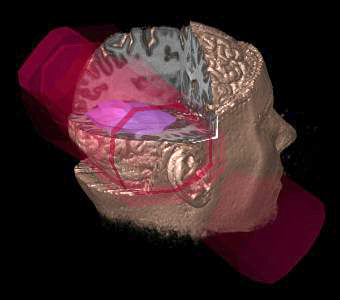
This image suggests one possible way in which volume rendering might be used to assist clinicians plan radiation treatment for cancer patients. The image is a volume rendering of a 256 x 256 x 109 voxel magnetic resonance (MR) scan of a live human subject. A polygonally defined target volume (in purple) and three treatment beams (in red) have been added using a hybrid ray tracer capable of handling both polygon and volume data. A portion of the volume has been clipped away and the raw MR values have been mapped onto the exposed surfaces. This is a sample visualization, not a clinical study; the MR data and treatment plan were taken from two different patients.
The image was generated by Marc Levoy and Victoria Interrante working under the supervision of Stephen M. Pizer and Henry Fuchs of the University of North Carolina at Chapel Hill. The MR data is courtesy of Siemens AG and was edited by Julian Rosenman of North Carolina Memorial Hospital, who also created the treatment plan. The MR data is available in the Stanford volume data archive.
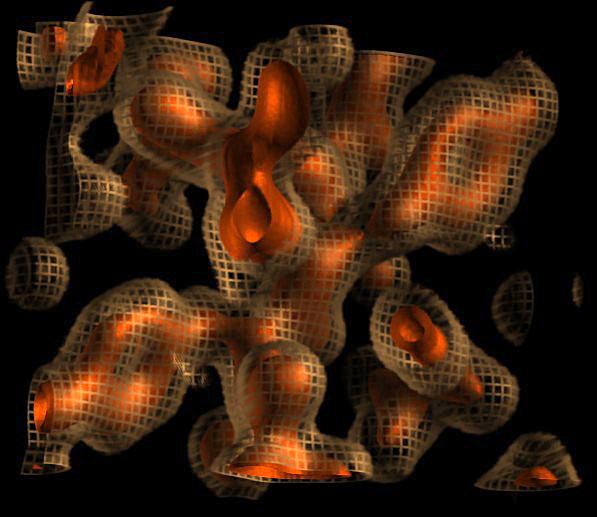
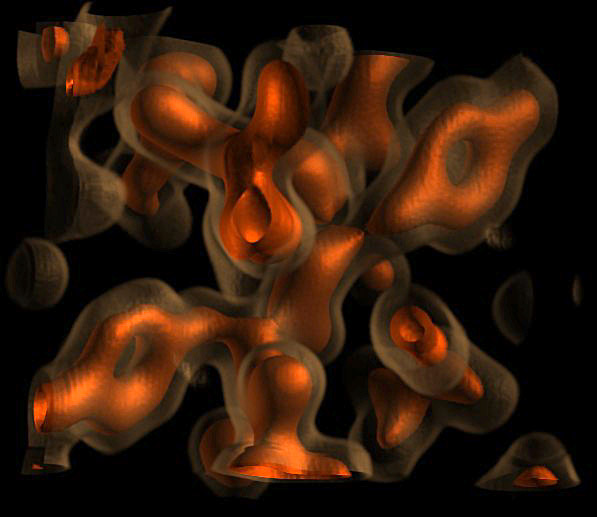
Volume rendering of two concentric isovalue contour surfaces from a 24 x 20 x 11 voxel portion of an electron density map for Staphylococcus Aureus ribonuclease. To enhance comprehension of the outer surface, its opacity in the leftmost image alternates between complete transmission and complete attenuation based on the value of a solid texture containing a honeycomb of small rectangular cells, creating a "burlap sack" effect. In the rightmost image, this modulation of opacity is suppressed, and the shape of the outer surface becomes harder to see.
The image was generated by Marc Levoy working under the supervision of Stephen M. Pizer and Henry Fuchs of the University of North Carolina at Chapel Hill. The data is courtesy of Dr. Chris Hill, University of York.
Marc Levoy, Display of Surfaces from Volume Data, IEEE Computer Graphics and Applications, Vol. 8, No. 3, May, 1988, pp. 29-37.
Marc Levoy, A Hybrid Ray Tracer for Rendering Polygon and Volume Data, IEEE Computer Graphics and Applications, Vol. 10, No. 2, March, 1990, pp. 33-40.
Levoy, M., Fuchs, H., Pizer, S.M., Rosenman, J., Chaney, E.L., Sherouse, G.W., Interrante, V., Kiel, J., Volume Rendering in Radiation Treatment Planning, Proc. First Conference on Visualization in Biomedical Computing, IEEE Computer Society Press, Atlanta, Georgia, May, 1990, pp. 4-10.
Marc Levoy, Levoy, M., Photorealistic Volume Rendering in Scientific Visualization, SIGGRAPH '91 Photorealistic Volume Modeling and Rendering Techniques course notes, Las Vegas, Nevada, July, 1991, pp. 2-1 - 2-13.