Exploration of the Brain's White Matter Pathways
with Dynamic Queries
Stanford University
Stanford University
Stanford University
Stanford University
Stanford University
IEEE Visualization 2004 (This paper has been extended in our IEEE TVCG 2005 article.)
Paper
Conference Presentation
Video (interface demonstration)
Software
Abstract
Diffusion Tensor Imaging (DTI) is a magnetic resonance imaging
method that can be used to measure local information about the
structure of white matter within the human brain. Combining DTI
data with the computational methods of MR tractography, neuroscientists
can estimate the locations and sizes of nerve bundles (white
matter pathways) that course through the human brain. Neuroscientists
have used visualization techniques to better understand tractography
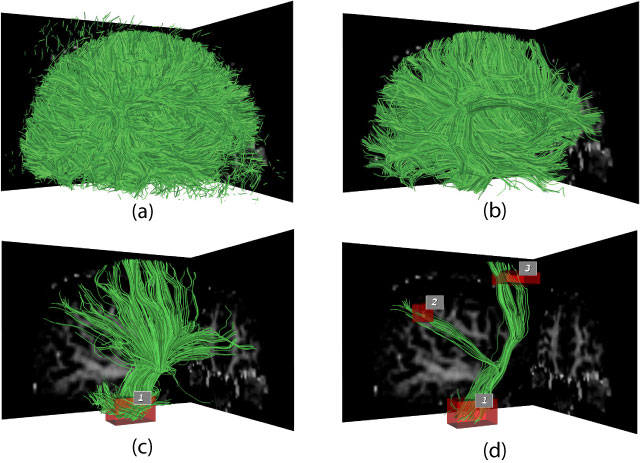
data, but they often struggle with the abundance and complexity
of the pathways. In this paper, we describe a novel set of
interaction techniques that make it easier to explore and interpret
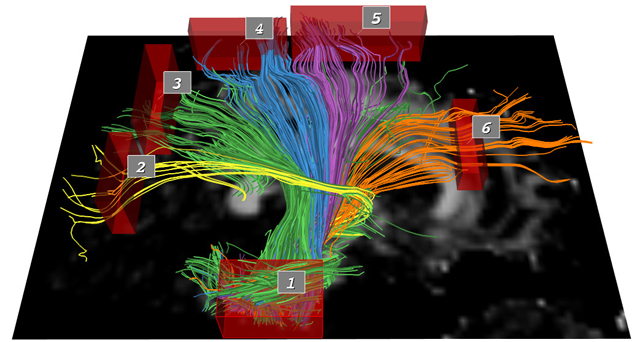
such pathways. Specifically, our application allows neuroscientists
to place and interactively manipulate box-shaped regions (or volumes
of interest) to selectively display pathways that pass through
specc anatomical areas. A simple and exible query language
allows for arbitrary combinations of these queries using Boolean
logic operators. Queries can be further restricted by numerical path
properties such as length, mean fractional anisotropy, and mean
curvature.
By precomputing the pathways and their statistical properties,
we obtain the speed necessary for interactive question-andanswer
sessions with brain researchers. We survey some questions
that researchers have been asking about tractography data and show
how our system can be used to answer these questions efficiently.
David Akers | Last updated 17 Oct 2004